In November 2014 I presented our paper GitHub Projects. Quality Analysis of Open-Source Software at SocInfo 2014 in Barcelona. It was nominated for the best paper award, and with 131 citations on Google Scholar it has become my most-cited paper. Here’s the story it told.
TL;DR
- Two yardsticks for an open-source project: how many stars it collects, and how quickly its team closes the issues users report, measured with survival analysis.
- Support is fast or never. Across 2,000 popular projects, 37% of issues were closed within 3 days, yet a quarter were still open a year later.
- Focused and engaged beats famous. Projects did better with developers who concentrate on them and follow the community than with popular, much-followed ones.
The talk
SocInfo, the International Conference on Social Informatics, brings computer scientists and social scientists together to study how online platforms and society shape each other. Its 6th edition took place in Barcelona on 11-13 November 2014, and I gave our talk on 12 November.
The paper was joint work with Błażej Gruszka, Szymon Jaroszewicz, Leszek Bukowski and Adam Wierzbicki, and it was nominated for the conference’s best paper award.
The question
Nobody assigns people to teams on GitHub. Every developer decides for themselves where to spend their time, so teams form on their own. That raises a simple question: is there a link between who works on a project and how good the project is?
To answer it, you first need a way to measure “good”. That turned out to be the harder half of the problem, and the paper’s main contribution.
The data
- Projects. From the public GitHub data in Google BigQuery we listed 164,418 mature repositories, at least two years old, and picked the 2,000 with the biggest monthly jump in stars. That filters out the personal and inactive projects that make up most of GitHub.
- People. For every developer on those projects we collected their public profile from the GitHub API: followers, people they follow, repositories, contributions, account age and typical working hours. The script is open source: wikiteams/supra-repos-x.
- Issues. Every issue opened, closed or reopened on GitHub during 2013, from the GitHub Archive.
Yardstick 1: stars
A star is GitHub’s way of saying “I like this”. Star counts are extremely skewed, with a few giants and a long tail, so we worked with their logarithm.
Even this simple measure had a surprise: the number of stars grows exponentially with the number of contributors. We couldn’t tell which way that runs, though. Popular projects may attract contributors, or many contributors may make a project popular.
Yardstick 2: how quickly issues get closed
Stars measure popularity, not whether anyone answers when you report a bug. For that we borrowed survival analysis from medicine, which studies how long it takes until an event happens. Here the event is an issue being closed. The method also handles issues that are still open when the data ends: we can’t know yet whether they’ll be closed next week or never, and the Kaplan-Meier estimator accounts for that properly.
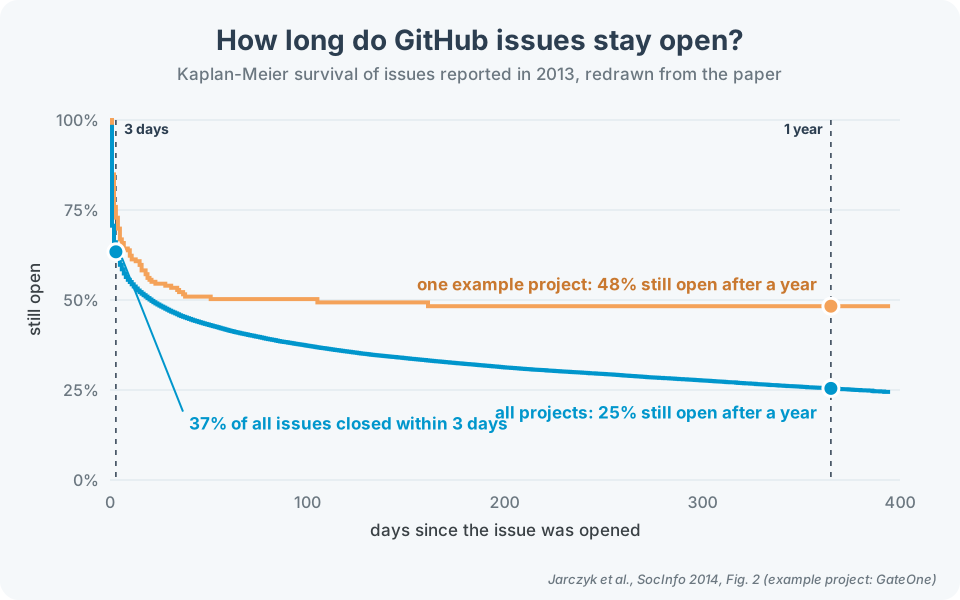
The pattern is fast or never. More than a third of issues were closed within 3 days, and then the curve flattens. A quarter of all issues were still open after a year, and in the example project about half were never addressed at all.
To compare projects, we summarised each one’s curve with just two numbers: the share of issues closed after 3 days (how fast you can expect an answer) and after 365 days (whether your issue will ever be resolved). Those two numbers capture about 94% of the variation across the seven time points we measured, almost as much as the best two-component summary a principal component analysis could find (96%), and anyone can read them.
What goes with more stars
A first model explained almost 80% of the differences in popularity, but mostly through activity: forks, commits, branches, releases. Those are more likely a result of popularity than its cause, since people fork projects they already know about. So we removed them and asked what else matters, in a model fitted on 1,755 projects.
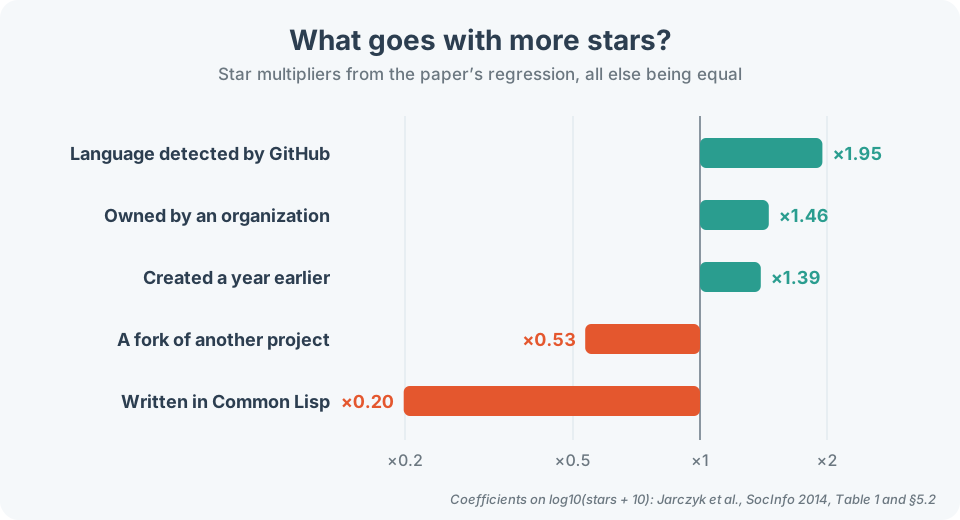
- Time helps. Stars accumulate, so every extra year of age goes with about 1.4 times more stars.
- Forks rarely shine. A fork collects about half the stars of an original project.
- Organizations help. Projects owned by an organization have about 1.5 times more stars.
- Language mostly doesn’t matter, with a few exceptions. Projects with no language GitHub could detect, often colour themes or documentation, were less popular, and Common Lisp projects had about 5 times fewer stars.
- New developers, popular projects. Projects whose developers had newer GitHub accounts were more popular, perhaps because people join GitHub to contribute to attractive projects.
Focused and engaged beats famous
The most interesting results came from the people. We averaged the developer traits over each project’s team and related them to both yardsticks:
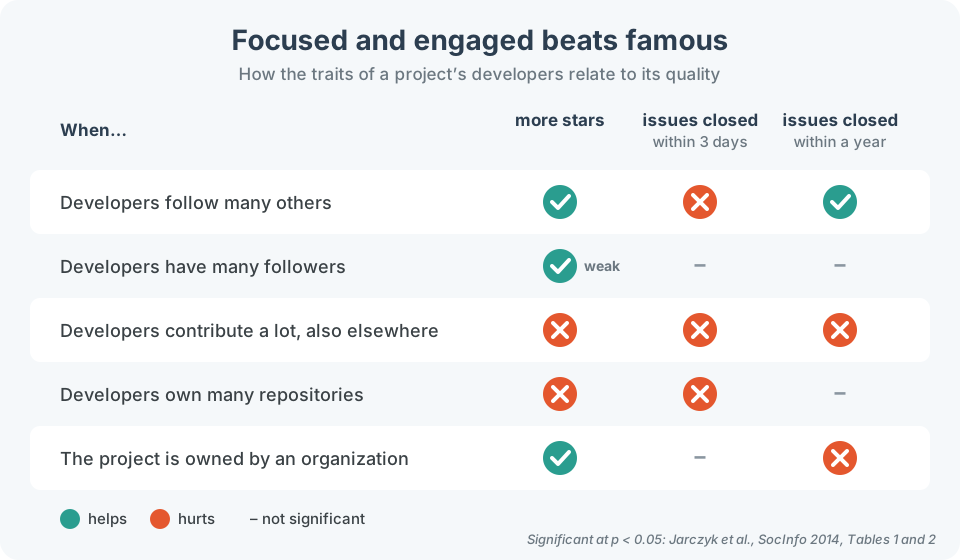
- Engaged developers help. Teams whose members follow many other developers had more popular projects and closed more of their long-standing issues, though, curiously, not faster first responses. Following others is a simple proxy for being engaged with the community.
- Famous developers help much less. Having developers with many followers was only weakly related to popularity, and not significantly related to support.
- Focus matters. Developers with many contributions, including to other projects, or with many repositories of their own, went with fewer stars and slower fixes. The practical advice from the paper: bring in people who can concentrate on your project.
- Organizations are a mixed blessing. Their projects were more popular, but worse at closing long-standing issues, probably because organizations put their effort into what matters to them rather than into user reports.
As always with observational data, these are associations, not proof of cause and effect.
Looking back
This paper started a line of research for me. Measuring issue closure with survival analysis became the core of our 2018 journal paper, Surgical teams on GitHub, and of my PhD on how open-source teams work. It has been cited 131 times since.
Today, star counts and how quickly maintainers respond are everyday signals people check before adopting a library.
Read the paper
Cite this paper (BibTeX)
@inproceedings{jarczyk2014github,
  title     = {GitHub Projects. Quality Analysis of Open-Source Software},
  author    = {Jarczyk, Oskar and Gruszka, B{\l}a{\.z}ej and Jaroszewicz, Szymon and Bukowski, Leszek and Wierzbicki, Adam},
  booktitle = {Social Informatics (SocInfo 2014)},
  series    = {Lecture Notes in Computer Science},
  volume    = {8851},
  pages     = {80--94},
  year      = {2014},
  publisher = {Springer},
  doi       = {10.1007/978-3-319-13734-6_6}
}

Oskar Jarczyk
If you enjoyed this post, you may also like my Facebook page. If you need help with Data science and ML, reach out to me at oskar.jarczyk@gmail.com.